This example is useful in Shiny-programming, where we have long timeline datasets what we want to filter by ID’s which are included in dataset as list-variable.
I have come across few times on obstacle, where I want to find ID’s from a list variable in a dataset. List variable includes all ID’s corresponding row, for example a date. Let’s create some test data to demonstrate.
library(dplyr)##
## Attaching package: 'dplyr'## The following objects are masked from 'package:stats':
##
## filter, lag## The following object is masked from '.env':
##
## n## The following objects are masked from 'package:base':
##
## intersect, setdiff, setequal, unionlibrary(purrr)
library(ggplot2)Create test data
We are going to create simple dataset with two variables id and date
d <- data.frame(
  id = sample(
    seq(1000, 9999, 1),
    20000,
    replace = TRUE
  ),
  date = sample(
    seq(as.Date("2000-01-01"), as.Date("2002-01-01"), by = 1),
    20000,
    replace = TRUE
  )
)
## This is sample data which need to be wrangled
head(d)
## id date
## 1 9686 2001-11-29
## 2 5214 2001-02-06
## 3 5305 2001-03-05
## 4 8889 2001-11-22
## 5 7380 2001-12-05
## 6 6554 2001-03-09Then we need to check data by dates. For example we are interested how many users has been in hospital by date.
date_data <- d %>%
  group_by(date) %>%
  summarise(
    n = n(),
    ids = list(unique(id))
  )
## `summarise()` ungrouping output (override with `.groups` argument)## sample data grouped by date
head(date_data)## # A tibble: 6 x 3
## date n ids
## <date> <int> <list>
## 1 2000-01-01 23 <dbl [23]>
## 2 2000-01-02 32 <dbl [32]>
## 3 2000-01-03 35 <dbl [35]>
## 4 2000-01-04 33 <dbl [33]>
## 5 2000-01-05 29 <dbl [28]>
## 6 2000-01-06 30 <dbl [30]>We can plot this data to some cool graphs
ggplot(date_data) +
  geom_line(aes(x=date, y=n))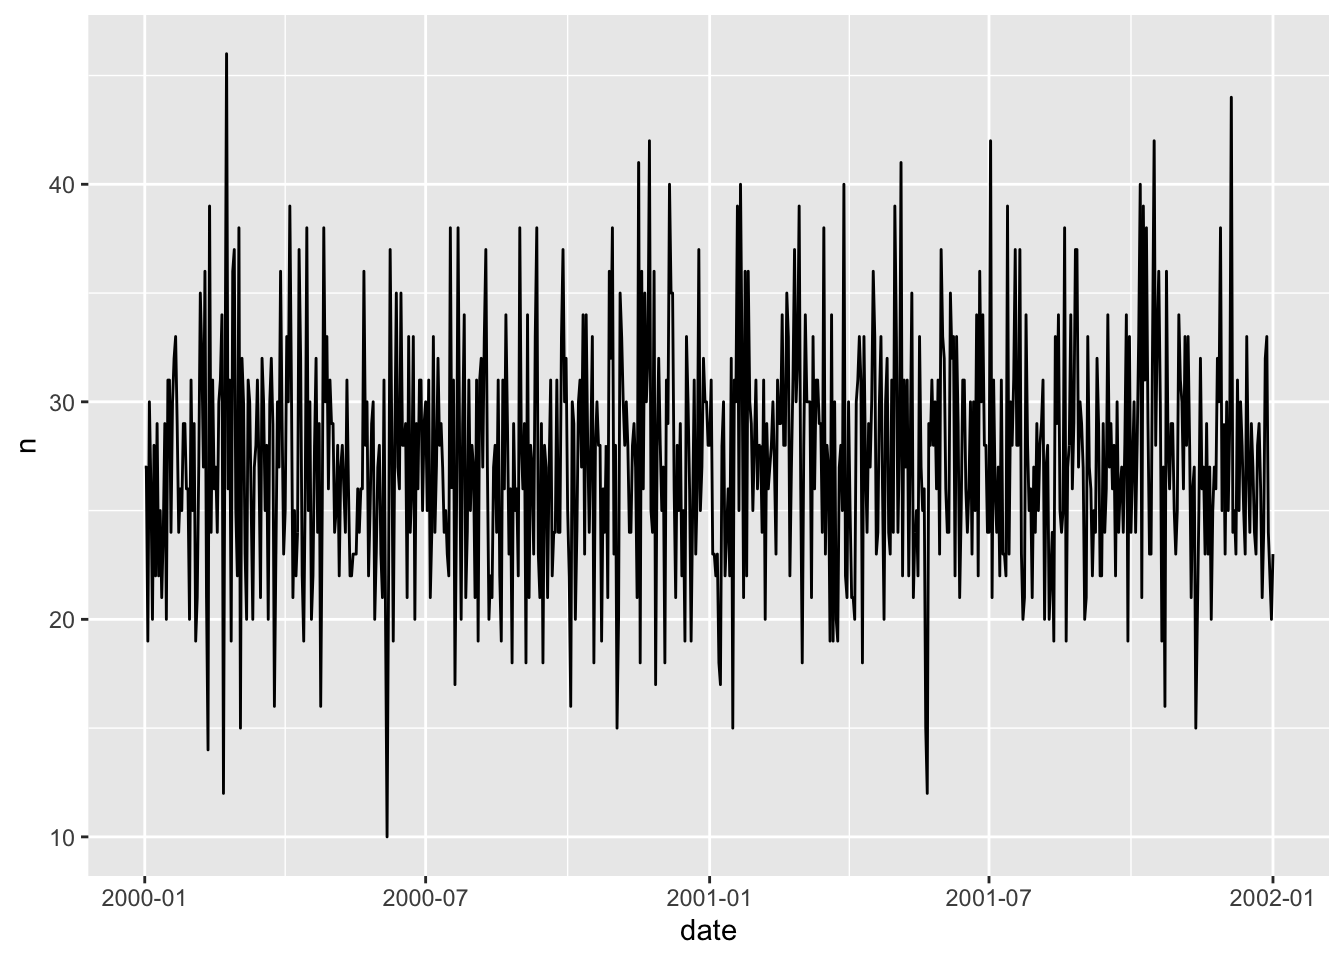
Filter function
But if we want to use same dataset, but only check small number of ID’s, getting dplyr verb filter() done can be tricky. Let’s first take random 5 ID’s from our dataset.
## get some id's what we want to filter by
myids <-sample(unlist(date_data$ids), 5)
## these are the id's what we want to find
myids
## [1] 2857 9959 5260 3043 7260For filtering the date_data we can use purrr::map_lgl() to get inside the list in dataset and find if any of our listed ID’s occur in date row,
# use map_lgl() function from purr package
d_sample <- date_data %>%
  filter(map_lgl(ids, ~ any(.x %in% myids)))
## Plot filtered dataset
ggplot(d_sample) +
geom_line(aes(x=date, y=n))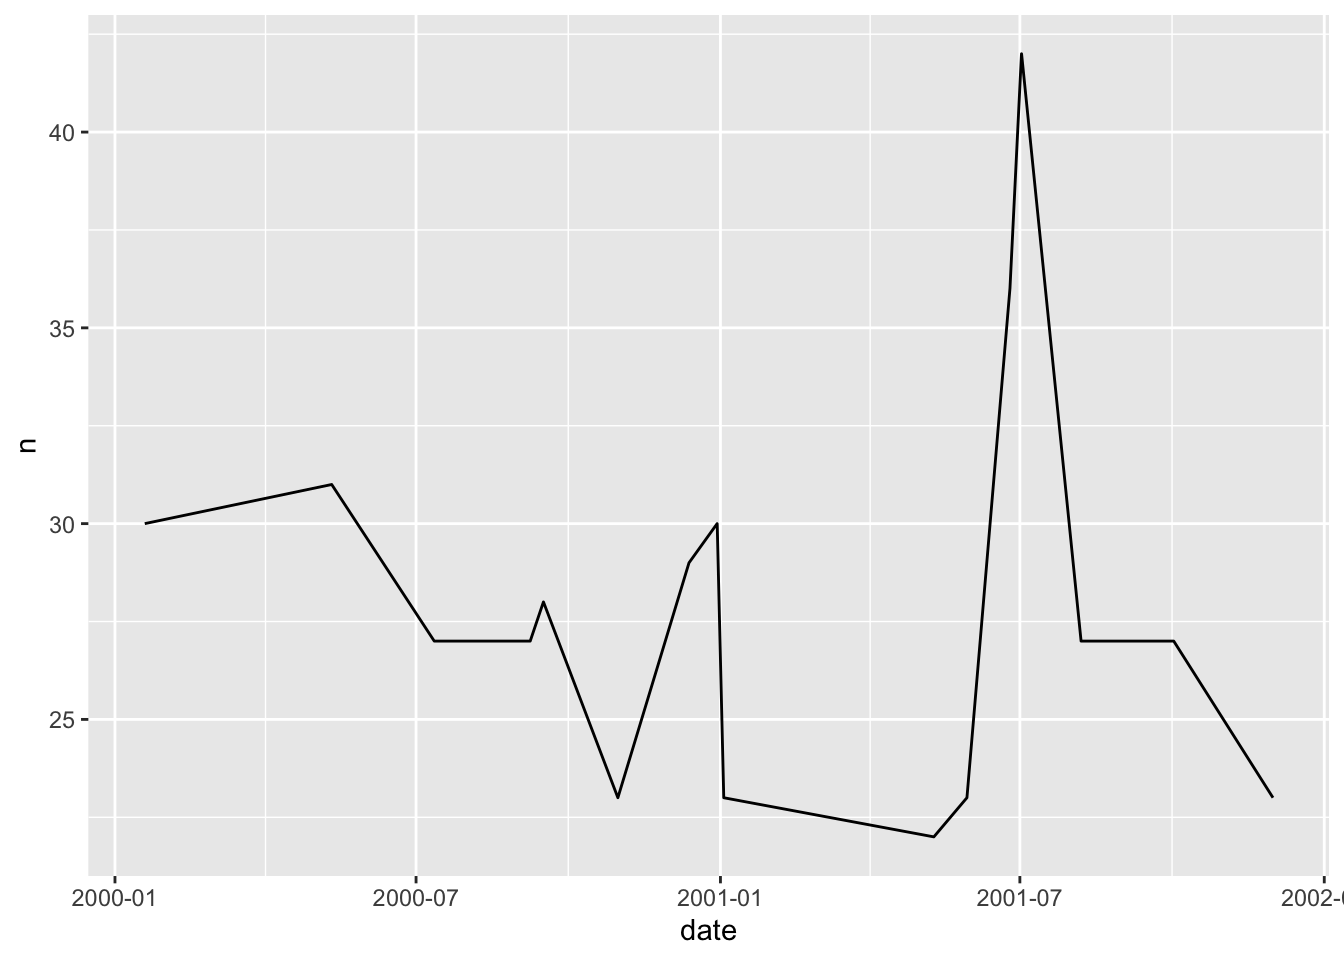
This function is especially useful in Shiny-programming, where we have calculated predatasets and we want to filter some long timeline data by ID’s.